Python
Last post, we outlined steps for calculating a stock’s MACD indicator.
In this post, we take MACD a step further by introducing Signal Line and Centerline Crossovers.
Signal Line Crossovers
Signal Line is defined as:
Signal Line: 9-day EMA of MACD Line
Signal line crossovers are the most common MACD signals. The signal line is a 9-day EMA of the MACD Line. As a moving average of the indicator, it trails the MACD and makes it easier to spot MACD turns. A bullish crossover occurs when the MACD turns up and crosses above the signal line. A bearish crossover occurs when the MACD turns down and crosses below the signal line. Crossovers can last a few days or a few weeks, it all depends on the strength of the move.
Let’s use Python to compute the Signal Line.
1. Start with the MACD Tutorial code.
import pandas.io.data as web
import pandas as pd
%matplotlib inline
import matplotlib.pyplot as plt

names = ['FB']

def get_px(stock, start, end):
     return web.get_data_yahoo(stock, start, end)['Adj Close']
px = pd.DataFrame({n: get_px(n, '1/1/2016', '1/17/2017') for n in names})
px['26 ema'] = pd.ewma(px["FB"], span=26)
px['12 ema'] = pd.ewma(px["FB"], span=12)
px['MACD'] = (px['12 ema'] - px['26 ema'])
2. Compute the 9 Day Exponential Moving Average of MACD.
px['Signal Line'] = pd.ewma(px['MACD'], span=9)3. Create Signal Line Crossover Indicator. When MACD > Signal Line, 1. When MACD < Signal Line, 0.
px['Signal Line Crossover'] = np.where(px['MACD'] > px['Signal Line'], 1, 0)
px['Signal Line Crossover'] = np.where(px['MACD'] < px['Signal Line'], -1, px['Signal Line Crossover'])
Centerline Crossovers
Centerline crossovers are the next most common MACD signals. A bullish centerline crossover occurs when the MACD Line moves above the zero line to turn positive. This happens when the 12-day EMA of the underlying security moves above the 26-day EMA. A bearish centerline crossover occurs when the MACD moves below the zero line to turn negative. This happens when the 12-day EMA moves below the 26-day EMA.
Centerline crossovers can last a few days or a few months. It all depends on the strength of the trend. The MACD will remain positive as long as there is a sustained uptrend. The MACD will remain negative when there is a sustained downtrend.
4. Create Centerline Crossover Indicator. When MACD > 0, 1. When MACD < 0, 0.
px['Centerline Crossover'] = np.where(px['MACD'] > 0, 1, 0)
px['Centerline Crossover'] = np.where(px['MACD'] < 0, -1, px['Centerline Crossover'])
Plotting Crossovers
Last post, we posed the question: ‘When would you enter the position ? ?’
Now that we understand Signal Line Crossovers, let’s propose that we enter the position, ‘buy’, on 1, and we exit the position, ‘sell’, on -1.
5. Create Buy/Sell Indicator, based on Signal Line Crossovers. Multiply by 2 to increase size of indicator when plotted, so ‘buy’ on 2 and ‘sell’ on -2.
px['Buy Sell'] = (2*(np.sign(px['Signal Line Crossover'] - px['Signal Line Crossover'].shift(1))))6. Plot close price, MACD & Signal Line, and Signal Line & Centerline Crossovers.
px.plot(y=['FB'], title='Close')
px.plot(y= ['MACD', 'Signal Line'], title='MACD & Signal Line')
px.plot(y= ['Centerline Crossover', 'Buy Sell'], title='Signal Line & Centerline Crossovers', ylim=(-3,3))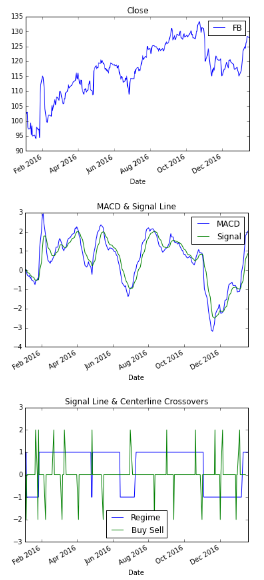
There you have it! We created MACD Signal Line and Centerline Crossovers, and based on the Crossovers, plotted ‘buy’ and ‘sell’ indicators.
Based on the entry and exit points, can you calculate the P&L? Stay tuned to find out.
Here’s the full code:
import pandas.io.data as web
import pandas as pd
%matplotlib inline
import matplotlib.pyplot as plt

names = ['FB']

def get_px(stock, start, end):
     return web.get_data_yahoo(stock, start, end)['Adj Close']
px = pd.DataFrame({n: get_px(n, '1/1/2016', '1/17/2017') for n in names})
px['26 ema'] = pd.ewma(px["FB"], span=26)
px['12 ema'] = pd.ewma(px["FB"], span=12)
px['MACD'] = (px['12 ema'] - px['26 ema'])
px['Signal Line'] = pd.ewma(px['MACD'], span=9)
px['Signal Line Crossover'] = np.where(px['MACD'] > px['Signal Line'], 1, 0)
px['Signal Line Crossover'] = np.where(px['MACD'] < px['Signal Line'], -1, px['Signal Line Crossover'])
px['Centerline Crossover'] = np.where(px['MACD'] > 0, 1, 0)
px['Centerline Crossover'] = np.where(px['MACD'] < 0, -1, px['Centerline Crossover'])
px['Buy Sell'] = (2*(np.sign(px['Signal Line Crossover'] - px['Signal Line Crossover'].shift(1))))

px.plot(y=['FB'], title='Close')
px.plot(y= ['MACD', 'Signal Line'], title='MACD & Signal Line')
px.plot(y= ['Centerline Crossover', 'Buy Sell'], title='Signal Line & Centerline Crossovers', ylim=(-3,3))