Relative Strength Index (RSI) Strategy Backtest
Contact: andrewshamlet@gmail.com // @andrewshamlet
Download the IPython Notebook that accompanies this Tutorial from Github.
View the Quantopian Backtest here.
Summary
- The Relative Strength Index (RSI) is a momentum indicator that compares the magnitude of recent gains and losses over a specified time period. RSI values range from 0 to 100.
- For this strategy, we buy $FB when the RSI is less than 30, and we will sell $FB when the RSI is greater than 70. The RSI will be calculated at a minutely frequency, as opposed to a daily frequency.
- During 01/01/16 – 12/31/16,
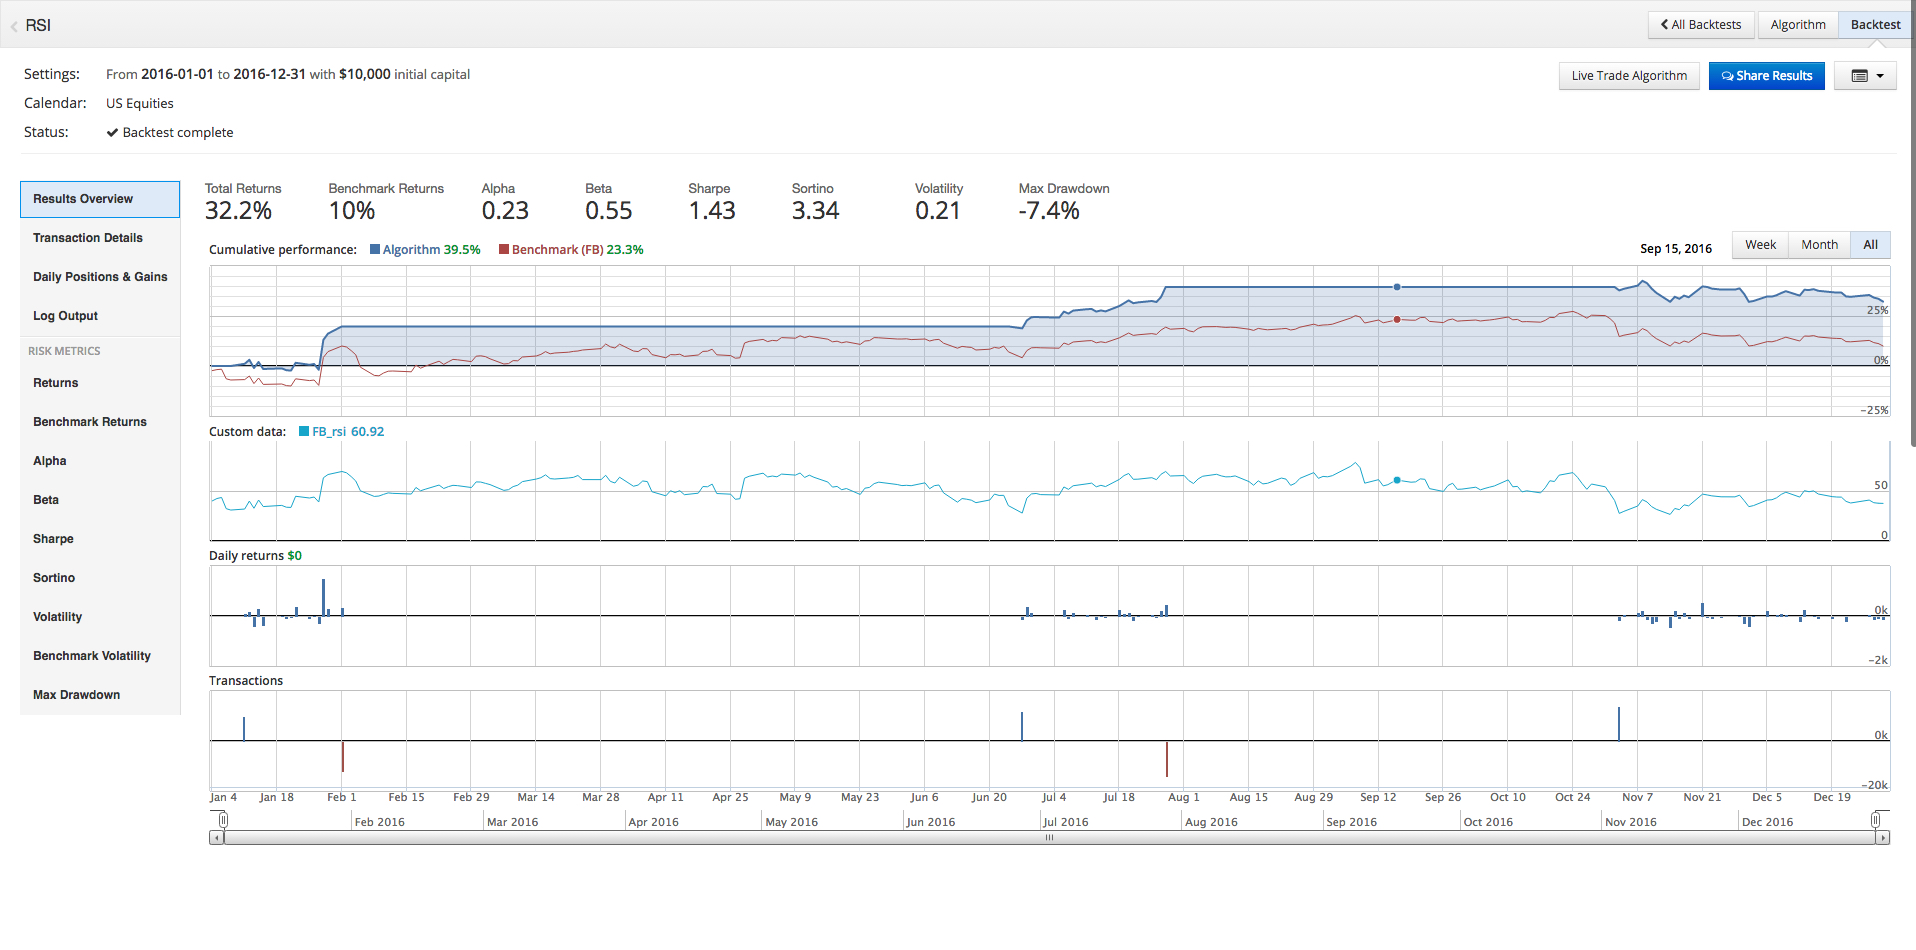
- The RSI Strategy produces 32.2% return, resulting in $3,220 pre-tax return.
- FB Buy & Hold produces 10.0% return, resulting in $1,000 pre-tax return.
- SPY Buy & Hold produces 12.0% return, resulting in $1,200 pre-tax return.
- Compared to the SPY Buy & Hold, the RSI Strategy produces $2,220 Alpha whereas FB Buy & Hold produces ($200) Alpha, both on $10,000, principal.
- During 05/19/12 – 12/31/16,
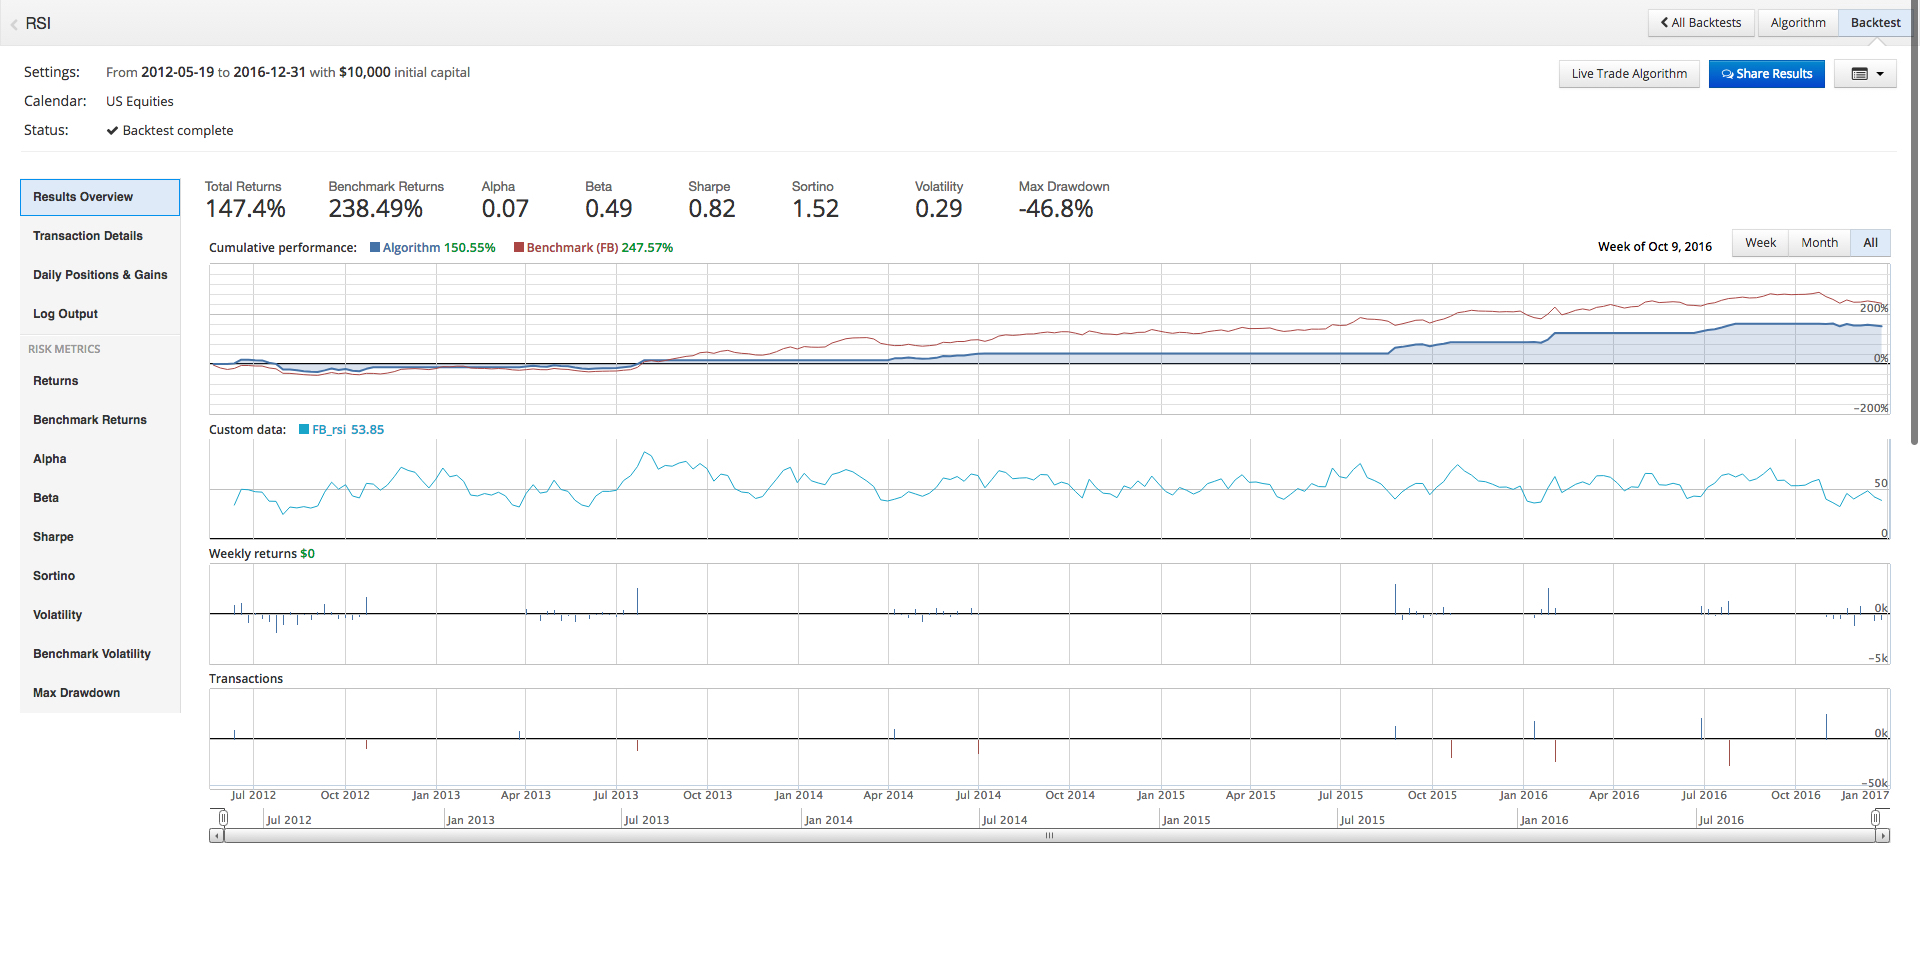
- The RSI Strategy produces 147.4% return, resulting in $14,740 pre-tax return.
- FB Buy & Hold produces 238.5% return, resulting in $23,850 pre-tax return.
- SPY Buy & Hold produces 89.6% return, resulting in $8,960 pre-tax return.
- Compared to SPY Buy & Hold, the RSI Strategy produces $5,780 Alpha whereas FB Buy & Hold produces $14,890 Alpha, both on $10,000 principal.
- Thus, on the broader time horizon, FB Buy & Hold outperforms the RSI Strategy.
- The question still stands: what about 2016 makes the RSI Strategy superior in performance to FB Buy & Hold?
Introduction
 In this post, we use Quantopian to build and backtest a Relative Strength Index (RSI) trading strategy.
Quantopian
About Quantopian:
“Quantopian provides capital, education, data, a research environment, and a development platform to algorithm authors (quants). Quantopian provides everything a quant needs to create a strategy and profit from it.
Quantopian’s members include finance professionals, scientists, developers, and students from more than 180 countries from around the world. The members collaborate in our forums and in person at regional meetups, workshops, and QuantCon, Quantopian’s flagship annual event.”
In other words, Quantopian is a website where one can build, test, and deploy trading strategies, using Python.
Relative Strength Index
To review, the Relative Strength Index (RSI) is a momentum indicator that compares the magnitude of recent gains and losses over a specified time period to measure speed and change of price movements of a security. It is primarily used to identify overbought or oversold conditions in the trading of an asset.
RSI values range from 0 to 100.
The Relative Strength Index (RSI) is calculated as follows:
RSI = 100 - 100 / (1 + RS)

RS = Average gain of last 14 trading days / Average loss of last 14 trading days
Strategy
For this strategy, we buy $FB when the RSI is less than 30, and we will sell $FB when the RSI is greater than 70. The RSI will be calculated at a minutely frequency, as opposed to a daily frequency.
Trading Strategy

Buy - RSI < 30

Sell - RSI > 70
Code
Here is the Python code for the RSI Strategy.
import talib
import numpy as np
import pandas as pd

def initialize(context):
    context.stocks = symbols('FB')
    context.pct_per_stock = 1.0 / len(context.stocks)
    context.LOW_RSI = 30
    context.HIGH_RSI = 70

    set_benchmark(sid(42950))

def handle_data(context, data):
    prices = data.history(context.stocks, 'price', 40, '1d')

    rsis = {}

    for stock in context.stocks:
        rsi = talib.RSI(prices[stock], timeperiod=14)[-1]
        rsis[stock] = rsi

        current_position = context.portfolio.positions[stock].amount

        if rsi > context.HIGH_RSI and current_position > 0 and data.can_trade(stock):
            order_target(stock, 0)

        elif rsi < context.LOW_RSI and current_position == 0 and data.can_trade(stock):
            order_target_percent(stock, context.pct_per_stock)

    record(FB_rsi=rsis[symbol('FB')])
At its foundation, Quantopian code is made up of three chunks: import modules, initialize, and handle_data.
1.) First we import the Talib, Numpy, and Pandas modules. As we’ll see, Talib streamlines the calculation of Technical Indicators.
import talib
import numpy as np
import pandas as pd
2.) The initialize function:
def initialize(context):
     context.stocks = symbols('FB')
     context.pct_per_stock = 1.0 / len(context.stocks)
     context.LOW_RSI = 30
     context.HIGH_RSI = 70

     set_benchmark(sid(42950))
2.a.) Define the security to trade, $FB.
context.stocks = symbols('FB') 2.b.) Define the weight of each security. Since the RSI Strategy trades one security, the weight is 1.0. If there were two securities, the weight would be 0.5.
context.pct_per_stock = 1.0 / len(context.stocks) 2.c.) Define the LOW_RSI value as 30
context.LOW_RSI = 30 2.d.) Define the HIGH_RSI value as 70
context.HIGH_RSI = 70 2.e.) Define the benchmark to which we will compare our strategy. In the example, the benchmark is set to $FB, essentially a buy and hold strategy. Remove ‘set_benchmark()’ to set the benchmark to the standard, ‘SPY’, or market rate.
set_benchmark(sid(42950)) 3.) The handle_data function:
def handle_data(context, data):
     prices = data.history(context.stocks, 'price', 40, '1d')

     rsis = {}

     for stock in context.stocks:
          rsi = talib.RSI(prices[stock], timeperiod=14)[-1]
          rsis[stock] = rsi

          current_position = context.portfolio.positions[stock].amount

          if rsi > context.HIGH_RSI and current_position > 0 and data.can_trade(stock):
               order_target(stock, 0)

          elif rsi < context.LOW_RSI and current_position == 0 and data.can_trade(stock):
               order_target_percent(stock, context.pct_per_stock)

     record(FB_rsi=rsis[symbol('FB')])
3.a.) Query the ‘FB’ historical price data for the past 40 trading days.
prices = data.history(context.stocks, 'price', 40, '1d') 3.b.) Create dictionary of RSI values.
rsis = {} 3.c.) Create for loop for RSI calculation and order logic.
for stock in context.stocks: 3.d.) Use Talib to calculate Relative Strength Index.
rsi = talib.RSI(prices[stock], timeperiod=14)[-1]3.e.) Save Talib output to dictionary.
rsis[stock] = rsi 3.f.) Save current portfolio positions in order to not execute too many/few orders.
current_position = context.portfolio.positions[stock].amount 3.g.) Order logic: if RSI is greater than 70 and positions are greater than 0, then sell all positions.
if rsi > context.HIGH_RSI and current_position > 0 and data.can_trade(stock):
               order_target(stock, 0)
3.h.) Order logic: if RSI is less than 30 and positions are equal to 0, then buy positions equal to weight defined in initialize function.
elif rsi < context.LOW_RSI and current_position == 0 and data.can_trade(stock):
               order_target_percent(stock, context.pct_per_stock)
3.i.) Chart RSI data for $FB.
record(FB_rsi=rsis[symbol('FB')])1 Year Performance
For the time period, 01/01/16 – 12/31/16
| % Return | Principal | Pre-Tax Return | Alpha | |
| RSI Strategy | 32.2% | $10,000 | $3,220 | $2,220 |
| FB Buy & Hold | 10.0% | $10,000 | $1,000 | ($200) |
| SPY Buy & Hold | 12.0% | $10,000 | $1,200 | N/A |
We backtest the RSI Strategy with a $10,000 principal for the time period, 01/01/16 – 12/31/16.
During 01/01/16 – 12/31/16,
- The RSI Strategy produces 32.2% return, resulting in $3,220 pre-tax return.
- FB Buy & Hold produces 10.0% return, resulting in $1,000 pre-tax return.
- SPY Buy & Hold produces 12.0% return, resulting in $1,200 pre-tax return.
- Compared to the SPY Buy & Hold, the RSI Strategy produces $2,220 Alpha whereas FB Buy & Hold produces ($200) Alpha, both on $10,000, principal.
Beyond 1 Year Performance

Yes, $2,220 Alpha on $10,000 principal is impressive.
Before we go and bet the farm, let’s see how the RSI Strategy performs over a longer time period.
Since the ‘FB’ IPO occurred on 05/18/12, we will backtest for the period 05/19/12 – 12/31/16.
For the time period, 05/19/12 – 12/31/16
| % Return | Principal | Pre-Tax Return | Alpha | |
| RSI Strategy | 147.4% | $10,000 | $14,740 | $5,780 |
| FB Buy & Hold | 238.5% | $10,000 | $23,850 | $14,890 |
| SPY Buy & Hold | 89.6% | 10,000 | $8,960 | N/A |
During 05/19/12 – 12/31/16,
- The RSI Strategy produces 147.4% return, resulting in $14,740 pre-tax return.
- FB Buy & Hold produces 238.5% return, resulting in $23,850 pre-tax return.
- SPY Buy & Hold produces 89.6% return, resulting in $8,960 pre-tax return.
- Compared to SPY Buy & Hold, the RSI Strategy produces $5,780 Alpha whereas FB Buy & Hold produces $14,890 Alpha, both on $10,000 principal.
Thus, on the broader time horizon, FB Buy & Hold outperforms the RSI Strategy.
Concluding Thought
Over the long term, money would go further with the FB Buy & Hold strategy.
The question still stands: what about 2016 makes the RSI Strategy superior in performance to FB Buy & Hold?
Until next time!