Download the accompanying IPython Notebook for this Tutorial from Github.
Python
Last post, we outlined steps for calculating Bollinger Bands.
In this post, we introduce a new technical indicator, Price Channels.
Price Channels
Price Channels are lines set above and below the price of a security. The upper channel is set at the x-period high and the lower channel is set at the x-period low. For a 20-day Price Channel, the upper channel would equal the 20-day high and the lower channel would equal the 20-day low.
Price Channels can be used to identify upward thrusts that signal the start of an uptrend or downward plunges that signal the start of a downtrend. Price Channels can also be used to identify overbought or oversold levels within a bigger downtrend or uptrend.
Price Channels are calculated as follows:
Upper Channel: 20-day high
Lower Channel: 20-day low
Let’s use Python to compute Price Channels.
1. Import modules.
import pandas as pd
import pandas.io.data as web
import matplotlib.pyplot as plt
%matplotlib inline
2. Define function for querying the daily high.
def get_high(stock, start, end):
     return web.get_data_yahoo(stock, start, end)['High']
3. Define function for querying the daily low.
def get_low(stock, start, end):
     return web.get_data_yahoo(stock, start, end)['Low']
4. Define function for querying daily close.
def get_close(stock, start, end):
     return web.get_data_yahoo(stock, start, end)['Adj Close']
5. Query daily high, daily low, and daily close for ‘FB’ during 2016.
x = pd.DataFrame(get_high('FB', '1/1/2016', '12/31/2016'))
x['Low'] = pd.DataFrame(get_low('FB', '1/1/2016', '12/31/2016'))
x['Close'] = pd.DataFrame(get_close('FB', '1/1/2016', '12/31/2016'))
6. Compute 4 week high and 4 week low using rolling max/min. Add 50 day simple moving average for good measure.
x['4WH'] = pd.rolling_max(x['High'], 20)
x['4WL'] = pd.rolling_min(x['Low'], 20)
x['50 sma'] = pd.rolling_mean(x['Close'], 50)
7. Plot 4WH, 4WL, 50 sma, and daily close.
x.plot(y=['4WH', '4WL', '50 sma', 'Close'])
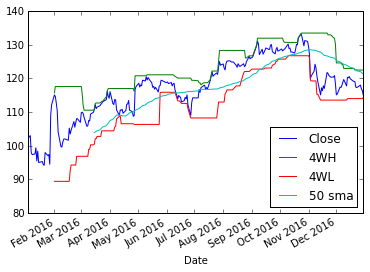
There you have it! We created our Price Channels. Here’s the full code:
import pandas as pd
import pandas.io.data as web
import matplotlib.pyplot as plt
%matplotlib inline

def get_high(stock, start, end):
     return web.get_data_yahoo(stock, start, end)['High']
def get_low(stock, start, end):
     return web.get_data_yahoo(stock, start, end)['Low']
def get_close(stock, start, end):
     return web.get_data_yahoo(stock, start, end)['Adj Close']

x = pd.DataFrame(get_high('FB', '1/1/2016', '12/31/2016'))
x['Low'] = pd.DataFrame(get_low('FB', '1/1/2016', '12/31/2016'))
x['Close'] = pd.DataFrame(get_close('FB', '1/1/2016', '12/31/2016'))

x['4WH'] = pd.rolling_max(x['High'], 20)
x['4WL'] = pd.rolling_min(x['Low'], 20)
x['50 sma'] = pd.rolling_mean(x['Close'], 50)

x.plot(y=['4WH', '4WL', '50 sma', 'Close'])
In celebration of completing this tutorial, let’s watch Ed Seykota sing ‘The Whipsaw Song’.